How Many Greens Should a 10 Handicap Hit?
15 May 2026 · 6 min
Read article
Before trying to reach a 3.0 Handicap Index, I reviewed my current golf stats to understand where the next 3.7 shots might be hiding.
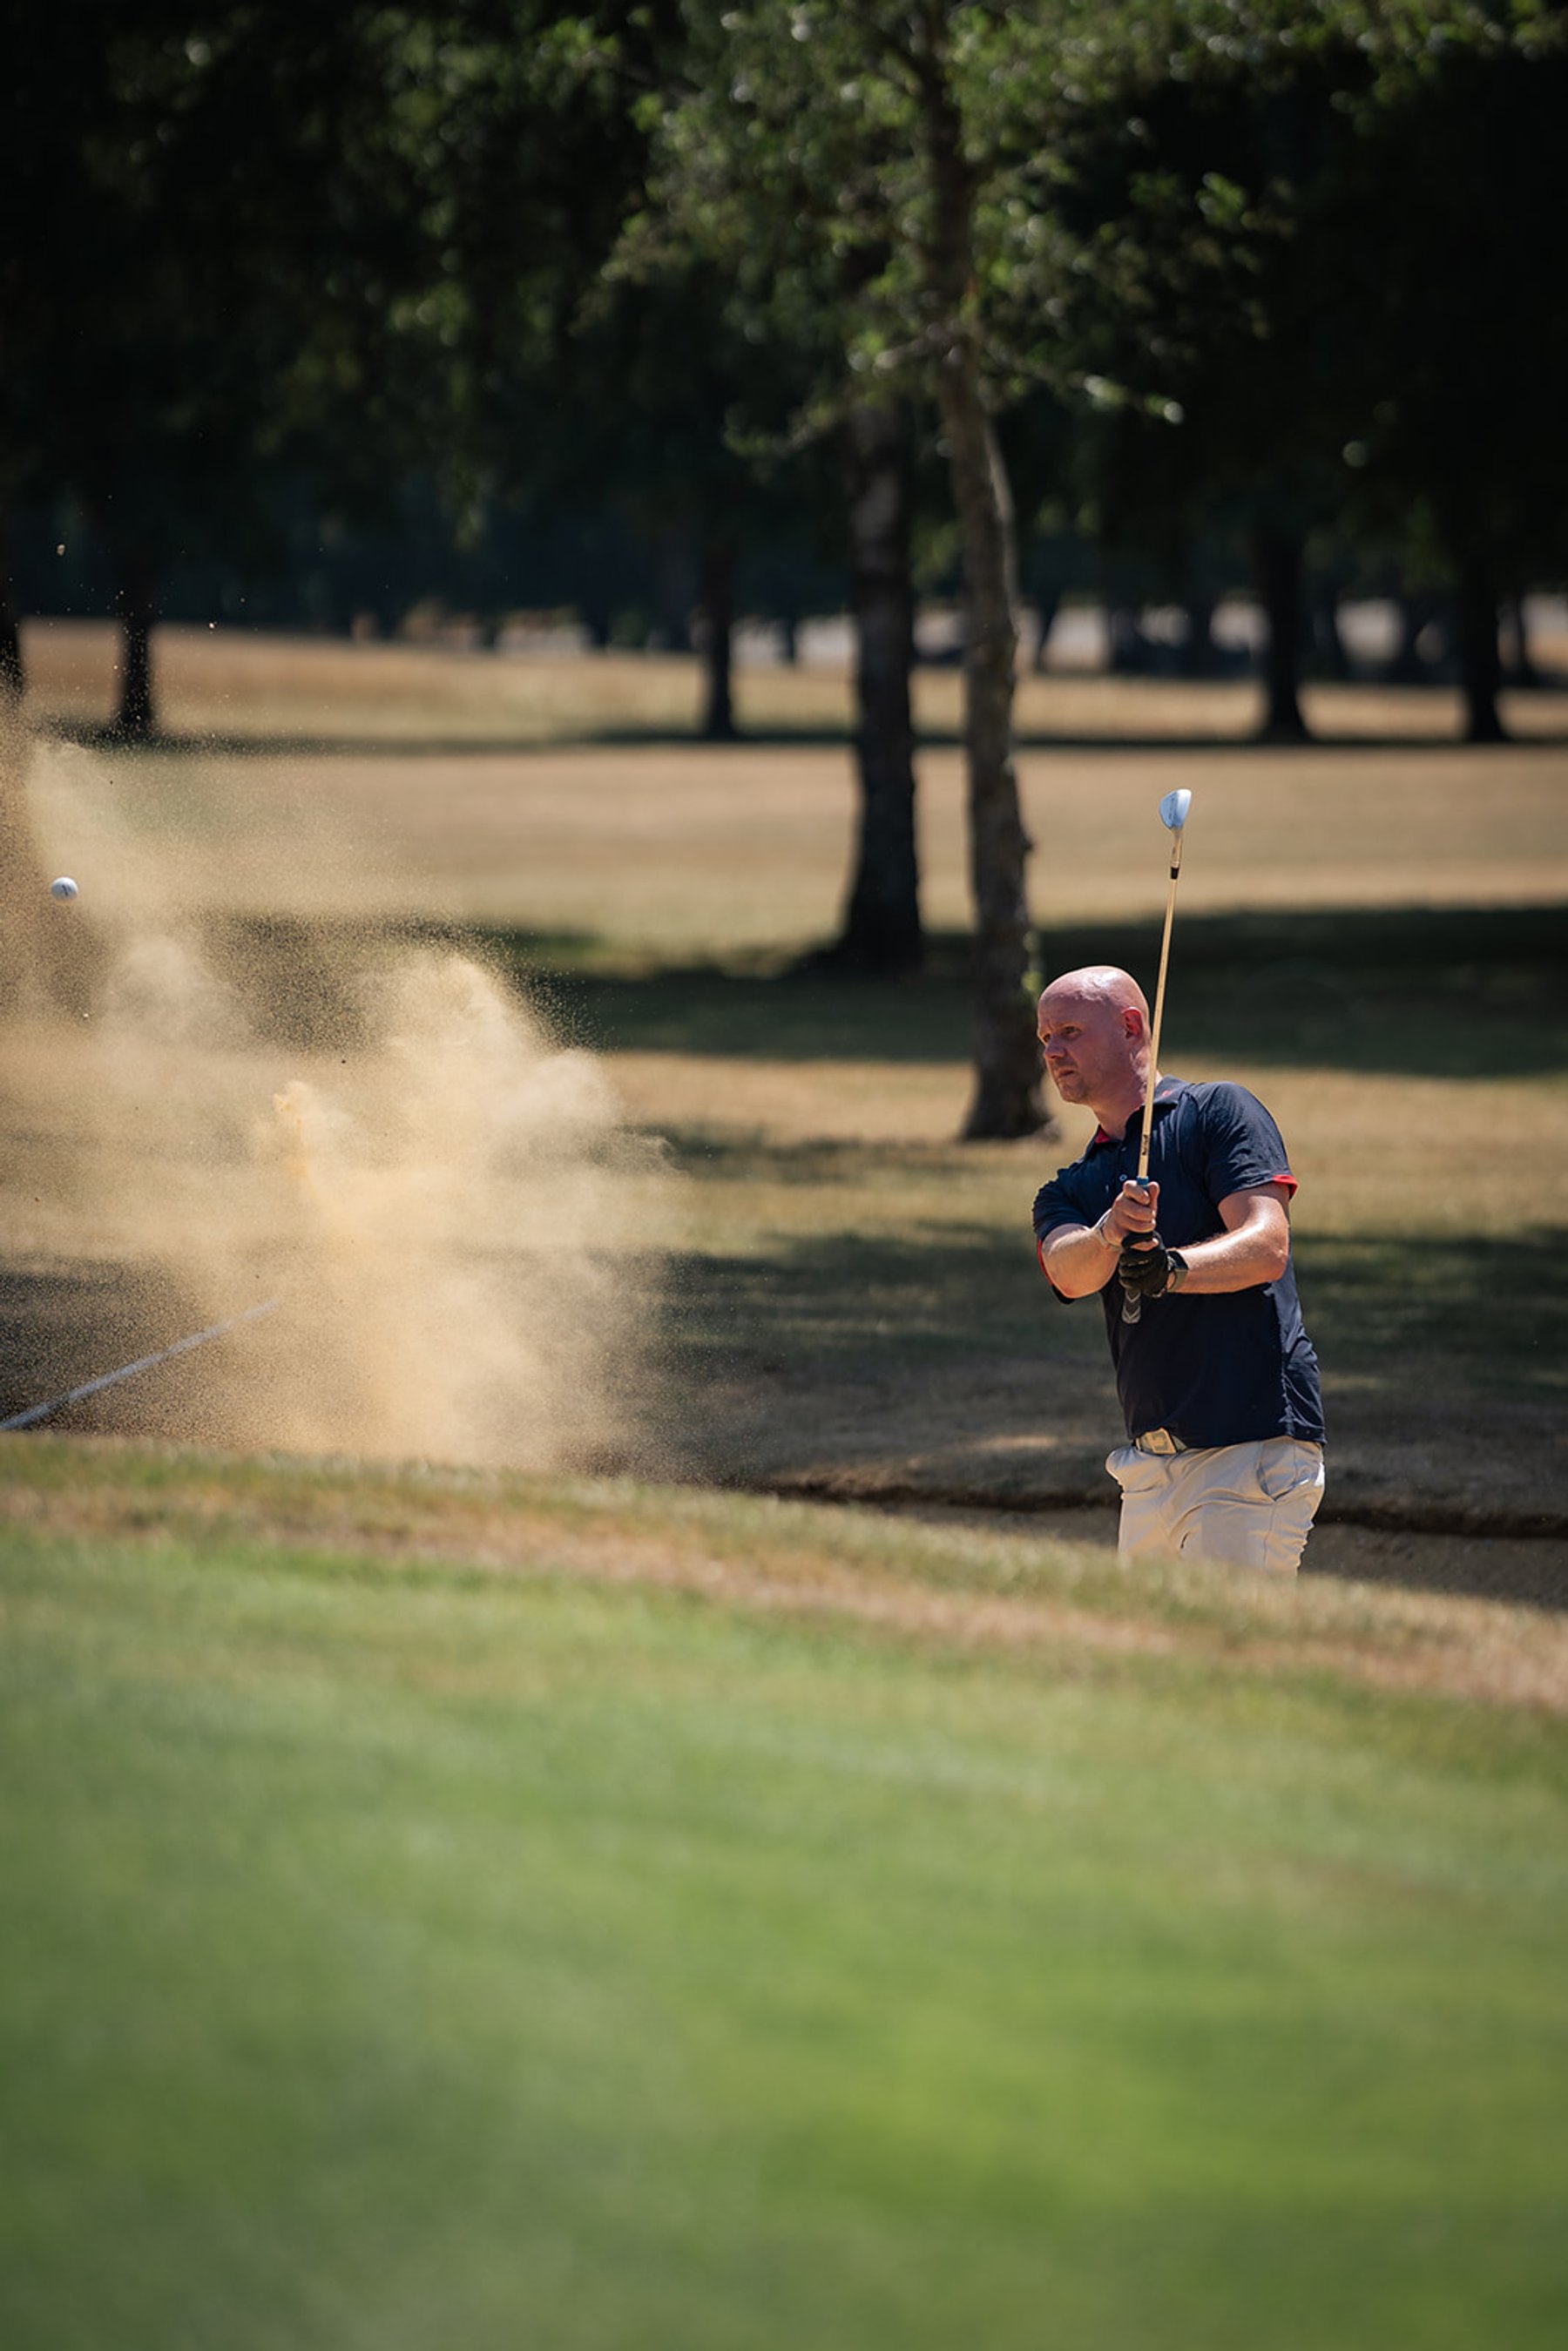
Before I try to reach a 3.0 Handicap Index, I need to understand the golfer I am right now. My golf stats show a game capable of some very good scoring, but also some obvious places where shots are still being left behind.
It is easy to say:
I want to get better at golf.
The harder question is:
Better at what?
Driving? Approach play? Putting? Short game? Course management? The mental side of scoring?
The whole point of the Bogeys2Birdies Project is to find out whether I can make genuine, measurable golf handicap improvement rather than endlessly chasing the latest swing thought or assuming I know what is costing me shots.
The target is a 3.0 Handicap Index.
But before deciding how I am going to get there, I need a starting point.
So I have taken the data I have been collecting in Precision Golf and looked properly at what my game actually looks like as of 14 August 2026.
Not what I think I am good at.
Not what frustrated me during my last round.
Not what felt good on the range.
The numbers.
And they have already given me plenty to work on.
My current Handicap Index is:
6.7
That has already come down significantly.
In mid-June, my recorded Handicap Index reached 10.1. Since then it has moved through 8.8, 8.0 and 7.7 before reaching 6.7 in early August.
So improvement is already happening.
That is encouraging, but it also makes the next stage more interesting.
Getting from around 10 to 7 is one challenge.
Going from 6.7 to 3.0 is another.
The margins get smaller. The bad decisions become more expensive. And shaving another 3.7 shots from my Handicap Index probably is not going to happen simply because I play more golf.
I need to understand where those shots are hiding.
Here is the starting point for the Bogeys2Birdies Project:
There is a lot to unpack there.
But my first reaction is probably not what I expected:
I do not think I need loads more birdies.
I think I need fewer disasters.
My current scoring average is:
79.5
But an average never tells the whole story.
My best recorded score is 71. There are also plenty of rounds in the 70s, including scores of 74, 76, 76 and 77.
One of those 76s included four birdies, eight pars and only one double-or-worse.
So the ability to play the golf required to lower my handicap is already there.
That matters.
I do not need to discover some completely new version of my golf game. I need to make the better version appear more frequently.
Because alongside those good scores are rounds where mistakes start multiplying and the score gets away from me.
That is probably the biggest difference between where I am now and where I want to be.
Consistency.
This is one of the most interesting parts of the data.
I am averaging:
2.1 birdies per round
Alongside approximately:
That changes how I think about the Road to 3.
The obvious temptation when trying to lower your golf handicap is to think you need to start producing spectacular golf.
Hit it closer. Hole more putts. Make more birdies.
But I do not think that is necessarily where my easiest gains are.
On an average day, I am already producing more than ten holes of par or better.
The damage comes elsewhere.
Those 1.6 doubles-or-worse per round are far more interesting to me.
If I can turn some doubles into bogeys, and some bogeys into pars, the scorecard starts to look very different without needing to make another birdie.
So one of the first principles of this project is becoming:
Stop chasing spectacular golf before eliminating stupid golf.
Breaking the scores down by hole type reveals another pattern.
My averages are:
The data covers 92 par-3s, 294 par-4s and 100 par-5s, so there is a useful amount of information behind those averages.
The par 5s clearly are not where most of the damage is happening. At only +0.1 per par 5, they are currently my strongest holes relative to par.
Par 4s are different.
At +0.5 per hole, they are where I am giving significantly more back to the course.
And because most golf courses contain more par 4s than anything else, small improvements here could have a disproportionate effect on my scoring average.
So rather than simply asking:
How do I make more birdies?
I want to start asking:
Why am I making bogey or worse on par 4s?
Bad drive? Poor approach? Missed green? Penalty? Three-putt? Bad decision?
That is something I will be digging into as the project develops.
My current greens in regulation figure is:
51%
That is roughly nine greens in a normal round.
For a golfer trying to move from a single-digit handicap towards a 3.0 Handicap Index, I think that is a reasonable platform to build from.
But the headline GIR number is not the most interesting part.
The misses are.
And one particular approach miss stands out:
Short.
The approach data records:
That is quite a difference.
The pattern continues when I look at approach distances.
From 100 to 150 yards, the data records 114 greens hit and 43 short misses.
From 150 to 200 yards, there are 121 greens hit and 61 short misses.
That immediately raises questions.
Am I not taking enough club? Am I overestimating my carry distances? Is strike quality dropping from longer distances? Am I properly accounting for wind and temperature? Am I selecting clubs based on the perfect strike rather than my normal strike?
Or is there another explanation entirely?
I do not know yet.
And that is exactly the point.
Instead of deciding that I need to "improve my irons", I now have something specific to investigate:
Why do so many of my approach shots finish short?
That sounds like the basis of a future Bogeys2Birdies experiment.
My fairways-hit percentage currently sits at:
45%
It is easy to look at that number and decide:
Driving needs fixing.
I am not convinced that is the right conclusion.
Fairways hit is useful, but it is also quite crude.
Missing a fairway by two yards and having a clear shot into the green is not remotely the same as hitting one behind a tree.
Yet both go down as a missed fairway.
The directional data is more interesting:
There is a slight bias towards the right, but I am clearly capable of missing it on either side.
What I really want to understand is not simply:
How can I hit more fairways?
It is:
How many of my tee shots actually cost me shots?
If I can miss the fairway but retain a clean route to the green, I am not particularly concerned.
If I am regularly hitting into trees, hazards or positions that force a recovery shot, that is completely different.
So driving accuracy is going to need deeper analysis than a simple fairway percentage.
Here is a statistic I do not like:
1.3 penalties per round
That is immediately interesting when the goal is finding 3.7 shots.
The data also demonstrates just how quickly penalties can destroy a score.
One recorded round included six penalty shots and resulted in an 88 (+16).
Obviously, I am not going to claim that eliminating a penalty automatically removes exactly one shot from every score. Golf is not that simple.
But averaging more than one penalty per round gives me a very obvious place to investigate.
And importantly, reducing penalties might not require a huge technical improvement.
Some penalties will undoubtedly come from poor swings.
But others could come from:
That is potentially a much easier route to lower scores than spending six months rebuilding my golf swing.
The first target seems obvious:
Get penalties comfortably below one per round.
My putting average is:
31.5 putts per round
At first glance, I do not think that screams:
Putting is destroying my scores.
But this is where basic golf statistics can become misleading.
Putts per round is heavily affected by how many greens you hit.
Miss a green, chip to three feet and hole it?
One putt.
Hit a green from 180 yards to 35 feet and two-putt?
Two putts.
The second hole may actually represent much better golf.
So I am not going to start the project with an arbitrary target of getting below 30 putts per round.
What does interest me is:
Three-putts.
There are 38 recorded holes with three putts or more in the data.
Those are shots I would like back.
The goal is not simply:
Take fewer putts.
It is:
Avoid unnecessary three-putts while improving my ability to convert genuine birdie opportunities.
That is a much more useful putting objective.
This number concerns me more:
31% scrambling
When I miss a green, I am currently getting up and down less than one-third of the time.
Combine that with a GIR of 51% and you can see the opportunity.
I am going to miss greens. Even if I reach a 3 handicap, I am still going to miss greens.
So what happens next matters enormously.
If I can turn more of those missed greens into pars, I do not necessarily need to dramatically improve my ball striking to lower my scores.
Interestingly, my recorded sand-save percentage is:
69%
So the problem does not immediately appear to be:
My entire short game is terrible.
There may be particular types of short-game situations where I am struggling.
Distance from the green. Lie. Shot selection. Proximity. Technique.
That is something else I want to investigate properly rather than simply standing next to a practice green hitting hundreds of random chip shots.
There is another encouraging sign in the data.
My recent scoring has been stronger than the overall baseline.
My last-ten scoring average is:
77.9
And the August numbers show:
That is progress.
But there are trade-offs too.
Putting during that period has risen to 32.4 per round, while scrambling has dropped to 24%.
That is a useful reminder that golf statistics cannot always be viewed independently.
If I hit more greens, I may naturally record more putts.
If I am missing fewer greens, the scrambling sample changes.
If my approaches finish further from the hole, putting becomes harder even though I have technically hit the green.
That is why Bogeys2Birdies is not going to obsess over one magic number.
I want to understand how the different parts of the game interact.
That is ultimately the question this article is supposed to answer.
Based on my starting golf stats, I have four early suspects.
At 1.3 per round, there is an obvious opportunity to remove unnecessary damage.
I am already making enough birdies to score well. The bigger opportunity may be turning bad holes into manageable ones.
At 31%, too many missed greens are becoming dropped shots.
Short is comfortably my most common recorded approach miss. I need to understand why.
These are not conclusions yet.
They are hypotheses.
And that distinction matters.
The next stage of the Bogeys2Birdies Project is to start testing them.
If I had to describe my golf purely from the data, I would say:
I am a 6.7 handicap golfer who already shows flashes of golf considerably better than 6.7.
I have shot 71.
I am hitting 51% of greens.
I am averaging more than two birdies per round.
My handicap has already moved significantly in the right direction.
The ceiling does not appear to be the biggest problem.
The floor does.
Too many expensive mistakes still creep into the scorecard:
That actually makes me more optimistic about trying to reach 3.
Because I do not necessarily need to become a completely different golfer.
I need to make the good golf I already produce more repeatable, while reducing the number of holes where I throw shots away.
So this is the line in the sand.
These numbers are not targets.
They are the starting point.
From here, every experiment, practice change, strategy adjustment and equipment decision can be measured against them.
Some of my assumptions will probably prove correct.
Others will not.
And some statistics I currently think are important may turn out to have very little to do with getting my handicap lower.
That is what I want to find out.
The destination is:
3.0
The starting line is:
6.7
3.7 shots to find.
Now I need to find out where they are.
Comments
No approved comments yet. Start the conversation.